Below are supplemental figures for the manuscript "Quantitative Standards for Fetal and Neonatal Autopsy"; these figures illustrate the regressions used for modeling standard deviations. Note that the citation numbers correspond to the references at the bottom of this document and not the references cited in the paper.
Body Weight Standard Deviation
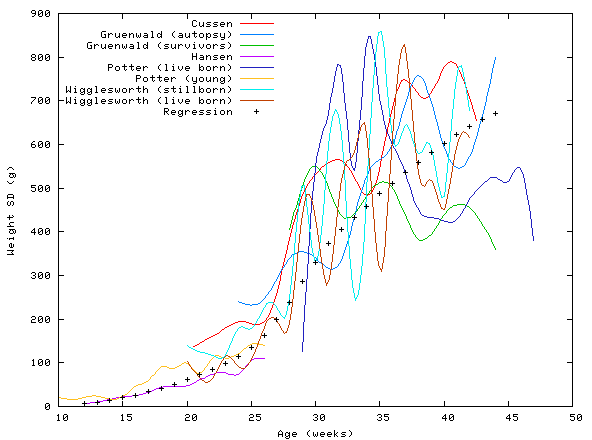
Figure S1: Body weight standard deviations and regression. The curves shown were created with data from Cussen et al.,1 Gruenwald and Minh,2,3 Hansen et al.,4 Potter,5 and Wigglesworth and Singer.6 The body weight standard deviation regression was derived by loess modeling; the standard deviation span was 0.6. The Potter (young)5 data were not included in the regression because there was evidently no attempt to select normal fetuses. Similarly, the Gruenwald (survivors)3 and Potter (live born)5 data were also excluded because the populations studied were not autopsy populations. The live born curves are shown to illustrate the difference between autopsy populations and populations of typical children.
Brain Weight Standard Deviation
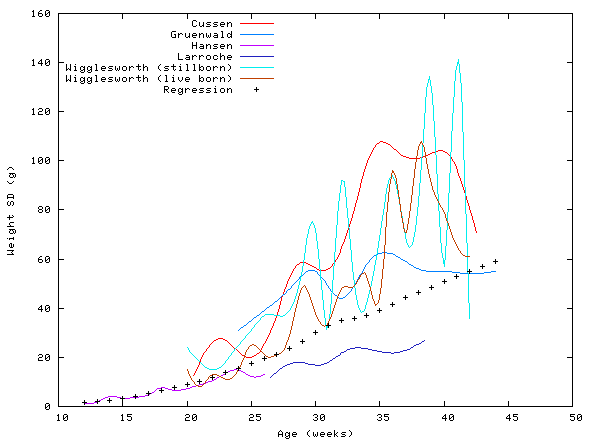
Figure S2: Brain weight standard deviations data and regression. The curves shown were created with data from Cussen et al.,1 Gruenwald and Minh,2 Hansen et al.,4 Larroche,7 and Wigglesworth and Singer.6 The brain weight standard deviation regression was derived by loess modeling; the span was 0.6.
Thymus Weight Standard Deviation
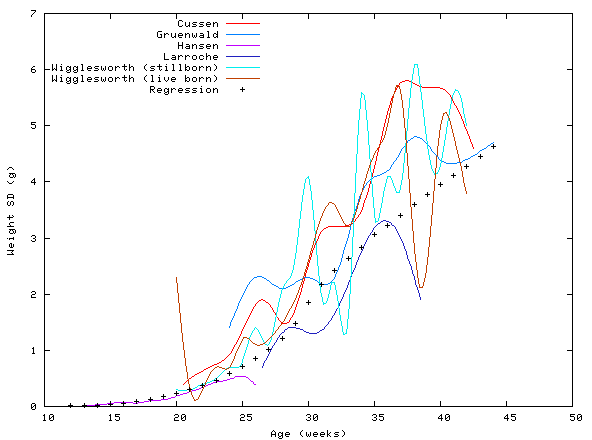
Figure S3: Thymus weight standard deviations and regression. The curves shown were created with data from Cussen et al.,1 Gruenwald and Minh,2 Hansen et al.,4 Larroche,7 and Wigglesworth and Singer.6 The thymus weight standard deviation regression was derived by loess modeling. The span was 0.6; for ages less than 19 weeks, the span was 0.3. Although Hansen et al.4 did not publish a standard deviation for the thymus weight at 12 weeks, a standard deviation of 0.01 was assumed.
Lungs Weight Standard Deviation
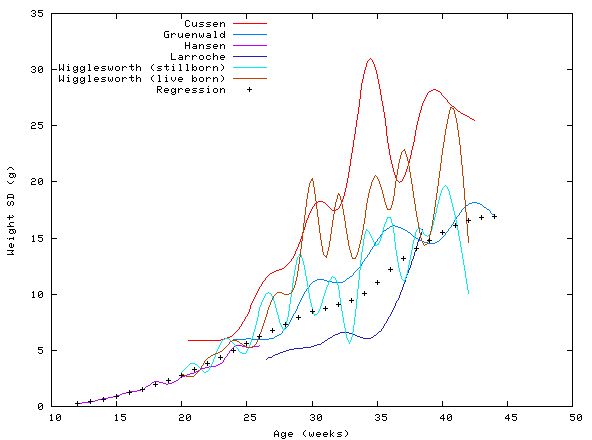
Figure S4: Lung weight (both lungs) standard deviations and regression. The curves shown were created with data from Cussen et al.,1 Gruenwald and Minh,2 Hansen et al.,4 Larroche,7 and Wigglesworth and Singer.6 The lung weight regression was derived by loess modeling; the span was 0.6.
Heart Weight Standard Deviation
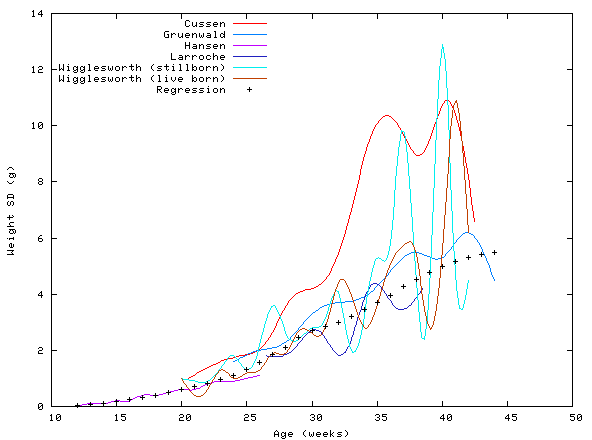
Figure S5: Heart weight standard deviations and regression. The curves shown were created with data from Cussen et al.,1 Gruenwald and Minh,2 Hansen et al.,4 Larroche,7 and Wigglesworth and Singer.6 The heart weight regression was derived by loess modeling; the span was 0.6.
Liver Weight Standard Deviation
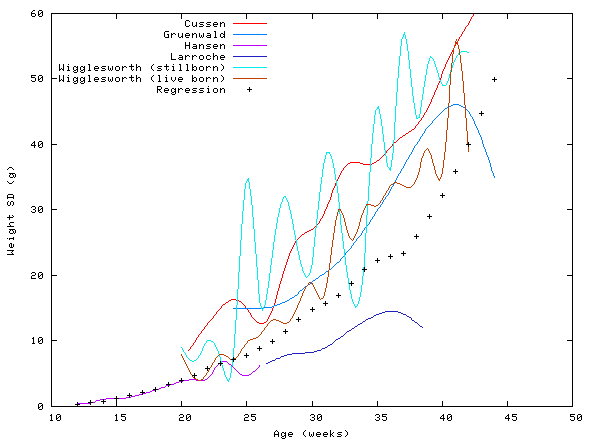
Figure S6: Liver weight standard deviations and regression. The curves shown were created with data from Cussen et al.,1 Gruenwald and Minh,2 Hansen et al.,4 Larroche,7 and Wigglesworth and Singer.6 The liver weight regression was derived by loess modeling; the span was 0.5.
Spleen Weight Standard Deviation
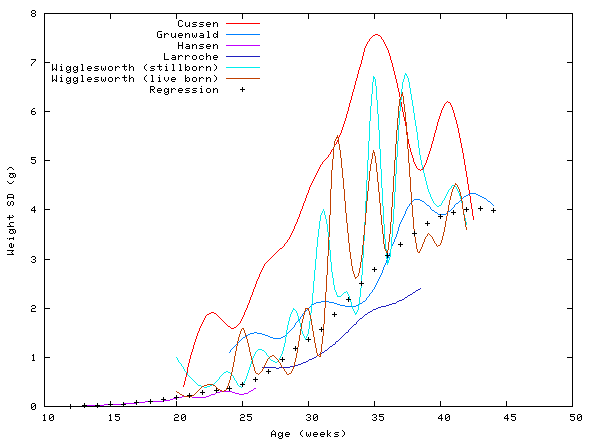
Figure S7: Spleen weight standard deviations and regression. The curves shown were created with data from Cussen et al.,1 Gruenwald and Minh,2 Hansen et al.,4 Larroche,7 and Wigglesworth and Singer.6 The spleen weight regression was derived by loess modeling; the span was 0.4. Although Hansen et al.4 did not publish a standard deviation for the thymus weight at 12 weeks, a standard deviation of 0.01 was assumed.
Adrenal Weight Standard Deviation
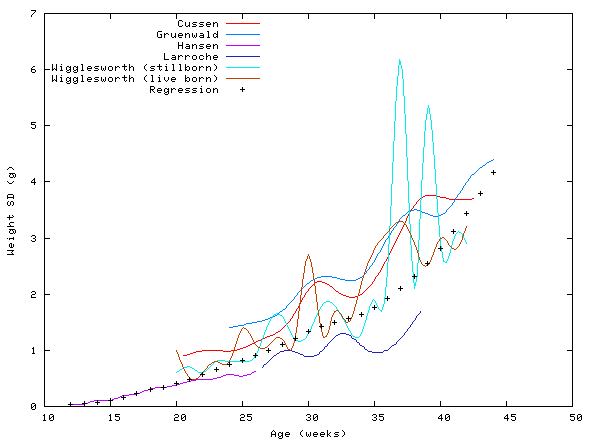
Figure S8: Adrenals weight (both adrenals) standard deviations and regression. The curves shown were created with data from Cussen et al.,1 Gruenwald and Minh,2 Hansen et al.,4 Larroche,7 and Wigglesworth and Singer.6 The adrenals weight regression was derived by loess modeling. The span was 0.7; for ages less than 19 weeks, the span was 0.3.
Pancreas Weight Standard Deviation
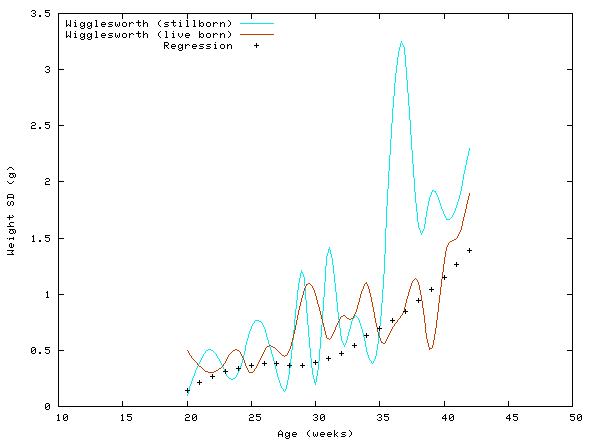
Figure S9: Pancreas weight standard deviations and regression. The curves shown were created with data from Wigglesworth and Singer.6 The pancreas weight regression was derived by loess modeling; the span was 0.8. Because Wigglesworth and Singer6 did not publish standard deviations for age 41 in live borns and age 21 in stillborns, standard deviations of 2.0 and 0.4, respectively, (the average of the values for the surrounding weeks) were assumed.
Kidney Weight Standard Deviation
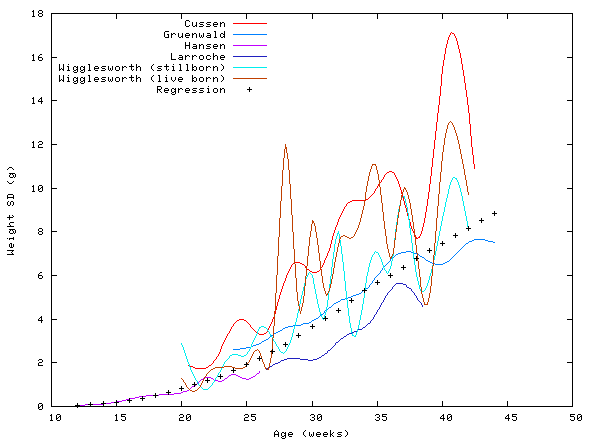
Figure S10: Kidney weight (both kidneys) standard deviations and regression. The curves shown were created with data from Cussen et al.,1 Gruenwald and Minh,2 Hansen et al.,4 Larroche,7 and Wigglesworth and Singer.6 The kidney weight regression was derived by loess modeling; the span was 0.6.
Crown-Heel Length Standard Deviation
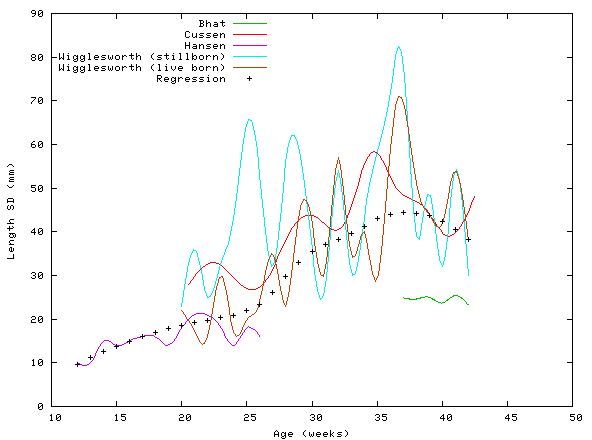
Figure S11: CHL standard deviations and regression. The curves shown were created with data from Bhat et al.,8 Cussen et al.,1 Hansen et al.,4 and Wigglesworth and Singer.6 The crown-heel length regression was derived by loess modeling; the span was 0.6. Furthermore, data from Bhat et al.8 were omitted from the regression, since they studied normal live borns and their data do not agree well with the other curves.
Crown-Rump Length Standard Deviation
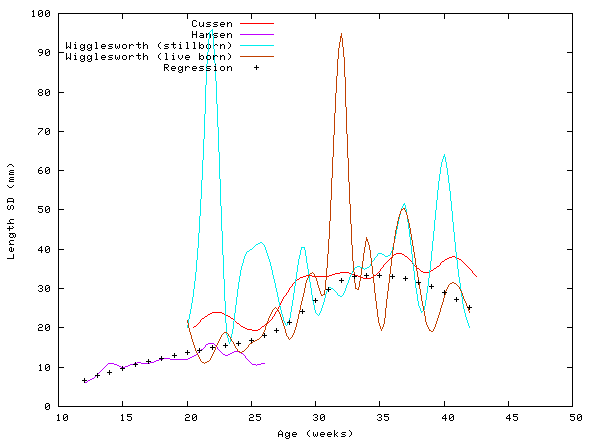
Figure S12: CRL standard deviations and regression. The curves shown were created with data from Cussen et al.,1 Hansen et al.,4 and Wigglesworth and Singer.6 The crown-rump length regression was derived by loess modeling; the span was 0.7.
Head Circumference Standard Deviation
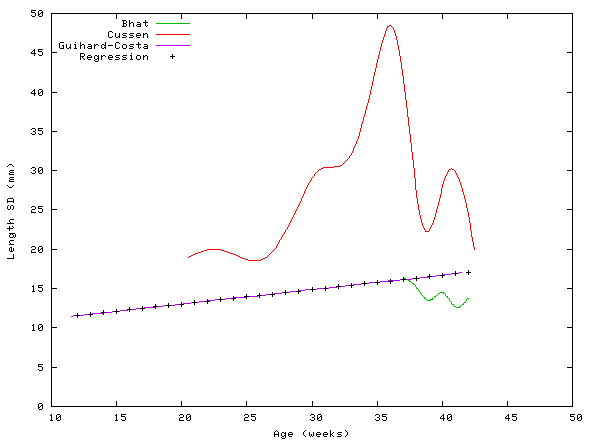
Figure S13: HC standard deviations and regression. The other curves shown were created with data from Bhat et al.,8 Cussen et al.,1 and Guihard-Costa et al.9 The data from Guihard-Costa et al.9 seemed to be a close match to the other curves, and they studied a large population. So, the head circumference regression is simply their model. Note that Bhat et al.8 have data only for term delivery, and their curve is relatively flat.
Biparietal Diameter Standard Deviation
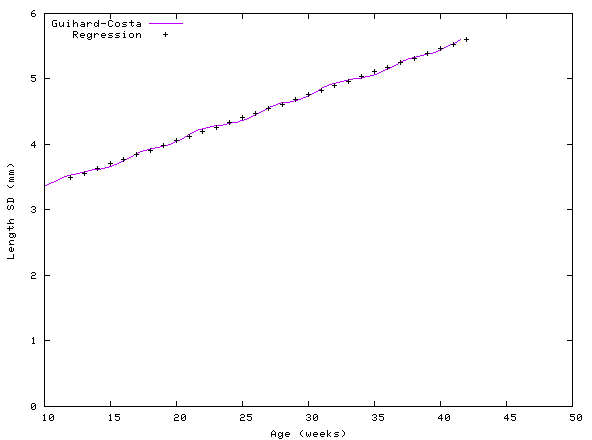
Figure S14: BPD standard deviation and regression. The curve shown was created with data from Guihard-Costa et al.9 As with the HC, the BPD regression is the model of Guihard-Costa et al.9
Outter Canthal Distance Standard Deviation
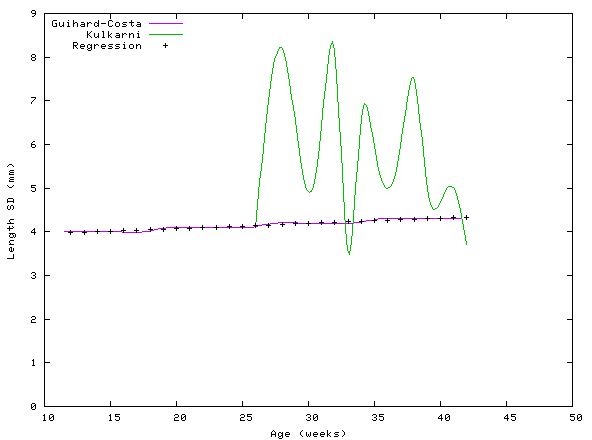
Figure S15: OCD standard deviations and regression. The curve shown was constructed with data from Guihard-Costa et al.9 and Kulkarni et al.10 The data from Guihard-Costa et al.9 seemed to be a close match to the other curves, and they studied a rather large population. So, the OCD regression is simply their model.
Inner Canthal Distance Standard Deviation
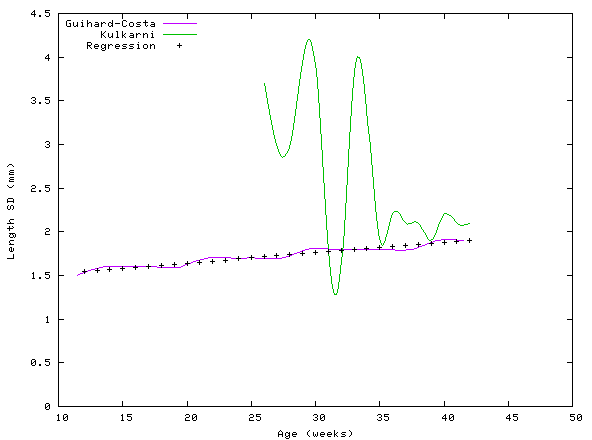
Figure S16: ICD standard deviations and regression. The curves shown were constructed with data from Guihard-Costa et al.9 and Kulkarni et al.10 As with OCD, the ICD regression is the model of Guihard-Costa et al.9
Inter-Nipple Distance Standard Deviation
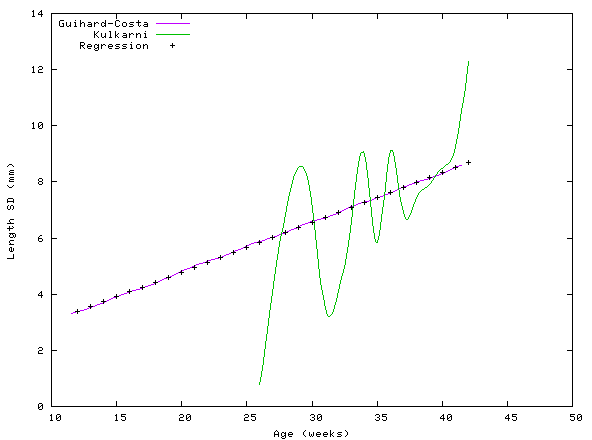
Figure S17: IND standard deviations and regression. The curves were constructed with data from Guihard-Costa et al.9 and Kulkarni and Rajendran.11 As with OCD, the IND regression is simply the polynomial model of Guihard-Costa et al.9
Hand Length Standard Deviation
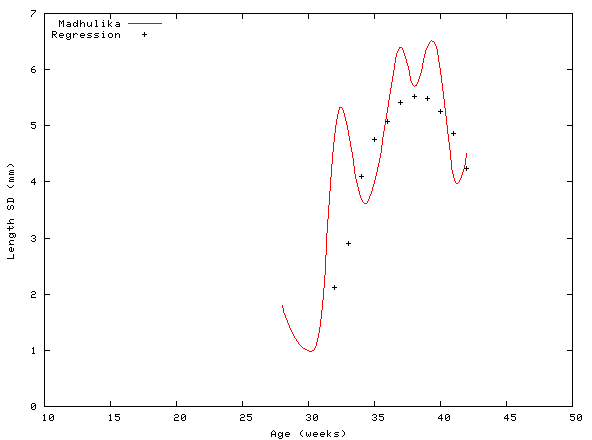
Figure S18: HL standard deviation and regression. The HL regression was derived by loess modeling; the span was 0.9. For computing standard deviations, only data from Madhulika et al.12 were considered.
Foot Length Standard Deviation

Figure S19: FL standard deviations and regression. The curves shown were constructed with data from Hansen et al.,4 Madhulika et al.,12 Merlob et al.,13 and Wigglesworth and Singer.6 The foot length regression was derived by loess modeling; the span was 0.8. Furthermore, the data from Madhulika et al.12 and Merlob et al.13 were excluded since those authors did not study autopsy populations.
References
- Cussen L, Scurry J, Mitropoulos G, et al. Mean organ weights of an Australian population of fetuses and infants. J Paediatr Child Health. 1990;26:101-103.
- Gruenwald P, Minh HN. Evaluation of body and organ weights in perinatal pathology. I. Normal standards derived from autopsies. Am J Clin Pathol. 1960;34:247-253.
- Gruenwald P, Minh HN. Evaluation of body and organ weights in perinatal pathology. II. Weight of body and placenta of surviving and of autopsied infants. Am J Obstet Gynecol. 1961;82:312-319.
- Hansen K, Sung CJ, Huang C, et al. Reference values for second trimester fetal and neonatal organ weights and measurements. Pediatr Dev Pathol. 2003;6:160-167.
- Potter EL. Pathology of the Fetus and Infant. 3rd ed. Chicago, IL: Year Book Medical Publishers; 1975.
- Wigglesworth JS, Singer DB. Textbook of Fetal and Perinatal Pathology. Amsterdam, Holland: Blackwell Publishers; 1991.
- Larroche J-C. Developmental Pathology of the Neonate. London, UK: Excerpta Medica; 1977.
- Bhat GJ, Mukelabai K, Shastri GN, et al. Anthropometric parameters of Zambian infants at birth. J Trop Pediatr. 1989;35:100-104.
- Guihard-Costa A-M, Menez F, Delezoide AL. Standards for dysmorphological diagnosis in human fetuses. Pediatr Dev Pathol. 2003;6:427-434.
- Kulkarni ML, Rajendran NK, Sangam DK. Inner canthal, outer canthal and inter pupillary distance in newborns. Indian Pediatr. 1992;29:759-763.
- Kulkarni ML, Rajendran NK. Internipple distance in the newborns. Indian Pediatr. 1992;29:619-620.
- Madhulika, Kabra SK, Barar V, et al. Upper and lower limb standards in newborn. Indian Pediatr. 1989;26:667-670.
- Merlob P, Sivan Y, Reisner SH. Lower limb standards in newborns. Am J Dis Child. 1984;138:140-142.